Exemple complet
Cette section présente des exemples de création de rapports Pivot depuis la création de la Source de données (requête SQL) jusqu’au rapport final.
CA par Commercial
1- Source de données
Pour la source de données, nous allons nous inspirer de la requête de la source de données « Commandes clients ».
On va juste lui ajouter ce qu’il faut pour avoir le commercial de chaque commande.
La requête se présente ainsi :
SELECT t.date_commande AS date_commande, (CASE MONTH(t.date_commande) WHEN 1 THEN ‘Jan’ WHEN 2 THEN ‘Fév’ WHEN 3 THEN ‘Mar’ WHEN 4 THEN ‘Avr’ WHEN 5 THEN ‘Mai’ WHEN 6 THEN ‘Jui’ WHEN 7 THEN ‘Juil’ WHEN 8 THEN ‘Aoû’ WHEN 9 THEN ‘Sep’ WHEN 10 THEN ‘Oct’ WHEN 11 THEN ‘Nov’ WHEN 12 THEN ‘Déc’ ELSE » END) AS Mois, (CASE QUARTER(t.date_commande) WHEN 1 THEN ‘1er Trim’ WHEN 2 THEN ‘2e Trim’ WHEN 3 THEN ‘3e Trim’ WHEN 4 THEN ‘4e Trim’ ELSE » END) AS Trimestre, (CASE WHEN MONTH(t.date_commande) < 7 THEN ‘1er Sem’ WHEN MONTH(t.date_commande) >= 7 THEN ‘2e Sem’ ELSE » END) AS Semestre, (CASE WHEN YEAR(t.date_commande) IS NOT NULL THEN YEAR(t.date_commande) ELSE » END) AS Année, (CASE t.fk_statut WHEN -1 THEN ‘Annulée’ WHEN 0 THEN ‘Brouillon’ WHEN 1 THEN ‘Validée’ WHEN 2 THEN ‘Livraison en cours’ WHEN 3 THEN ‘Livrée/Clôturée’ ELSE » END) AS Statut, t.total_ht AS total_ht, t.total_ttc AS total_ttc, llx_societe.nom AS client, u.login AS Commercial FROM llx_commande AS t LEFT JOIN llx_societe ON t.fk_soc = llx_societe.rowid LEFT JOIN llx_element_contact ec ON t.rowid = ec.element_id LEFT JOIN llx_user u ON ec.fk_socpeople = u.rowid WHERE ec.fk_c_type_contact = 91
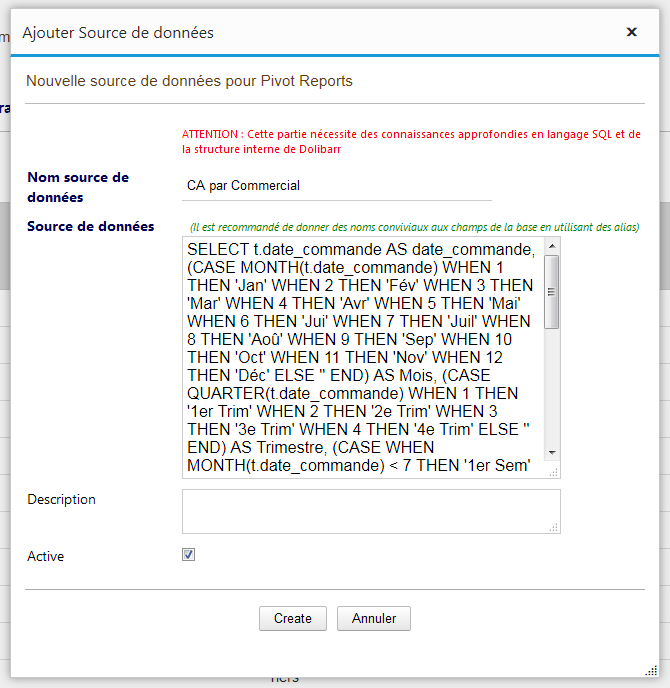
Pour créer cette source de données, allez à la page de configuration du module puis onglet « Sources de données ».
Clickez sur « Nouvelles source de données ».
Dans le dialogue qui s’affiche :
Dans le champ « Nom source de données », saisisez « CA par Commercial »
Copiez/Collez la requête SQL ci-dessus dans le champ « Source de données »
Clickez sur « Créer »
La nouvelle source de données est alors ajouté à la liste des Sources de données disponibles.
2- Rapport : Histogramme CA par Commercial par année
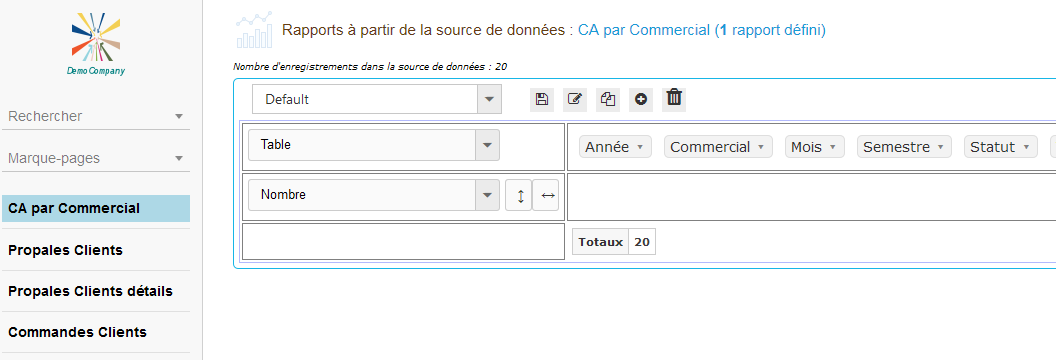
En ouvrant l’écran principal du module (click sur le menu haut « Pivot Reports »), on remarque que :
- Une nouvelle entrée « CA par Commercial » a été ajoutée au menu gauche
- En clickant sur cette entrée du menu gauche, un rapport vide par défaut a été créé et s’appelle « Default ».
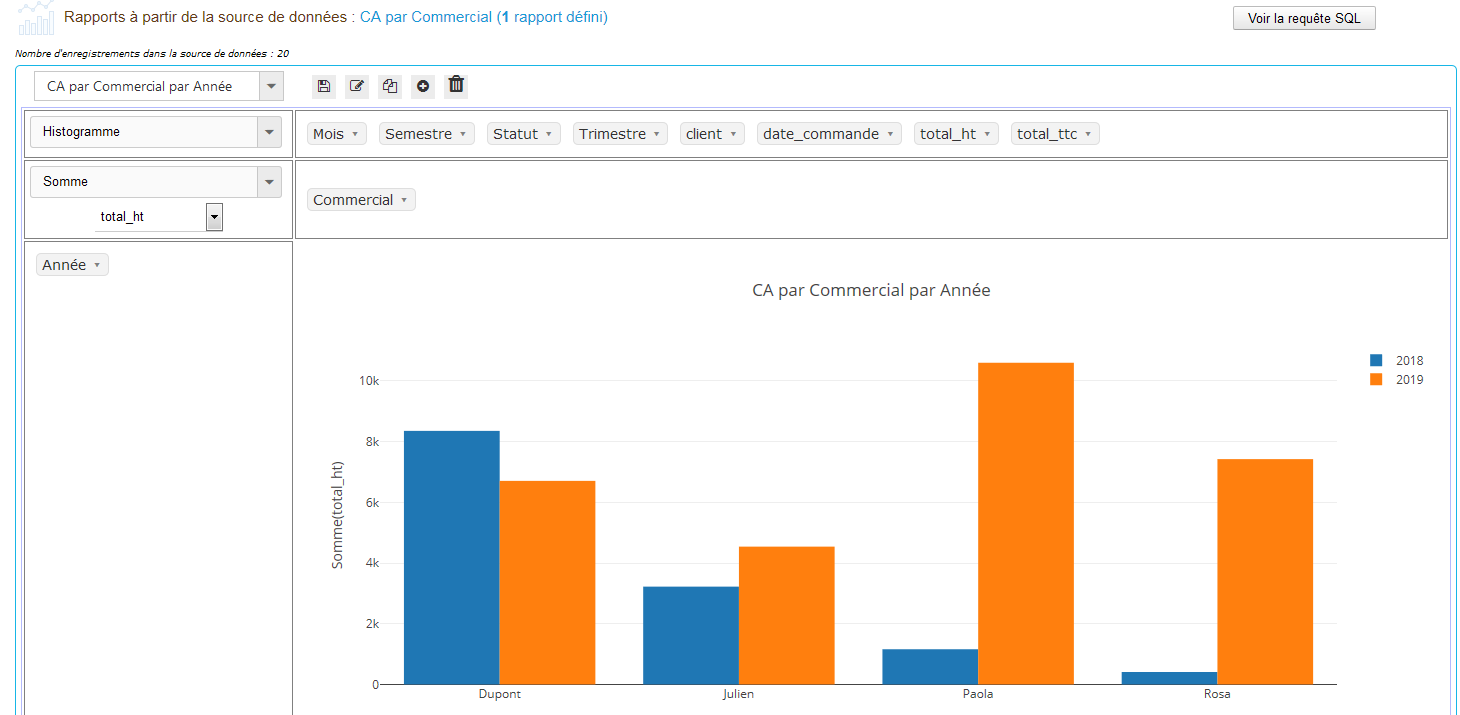
Pour créer le rapport « CA par Commercial par année » sous forme d’histogramme, nous procéderons comme suit :
- Renommer le rapport « Default » par « CA par Commercial par année »
- Choisir « Histogramme » dans la liste des vues disponibles
- Choisir « Somme » dans la liste des opérations possibles
- Choisir « total_ht » dans la liste des champs disponibles
- Glisser/Déposer le champ « Commercial » dans la zone des libellées de l’axe X
- Glisser/Déposer le champ « Année » dans la zone des séries
- Enregistrer
N.B. Cet exemple suppose qu’il y a un seul commercial par commande.
Si vous affectez plusieurs commerciaux à une commande, il est nécessaire d’adapter la requête SQL ci-dessus en conséquence.