Pivot tables features
Tables rendering types (Cross Tabs)
The Pivot control allows calculations to be made and presented in tabular format.
Examples of Pivot reports as Tables:
Simple table
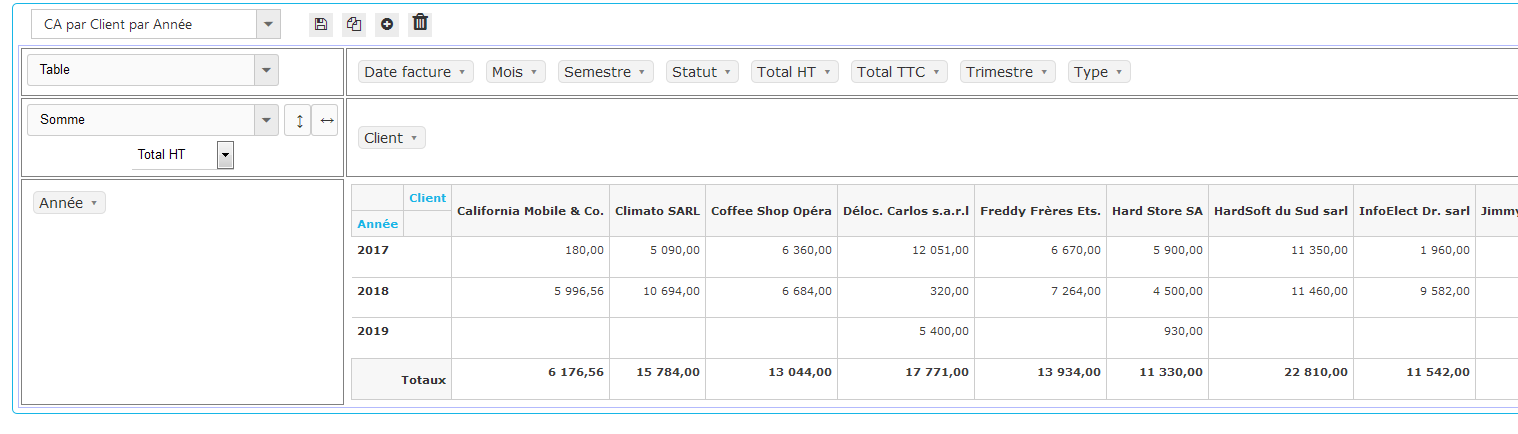
Table with Bars
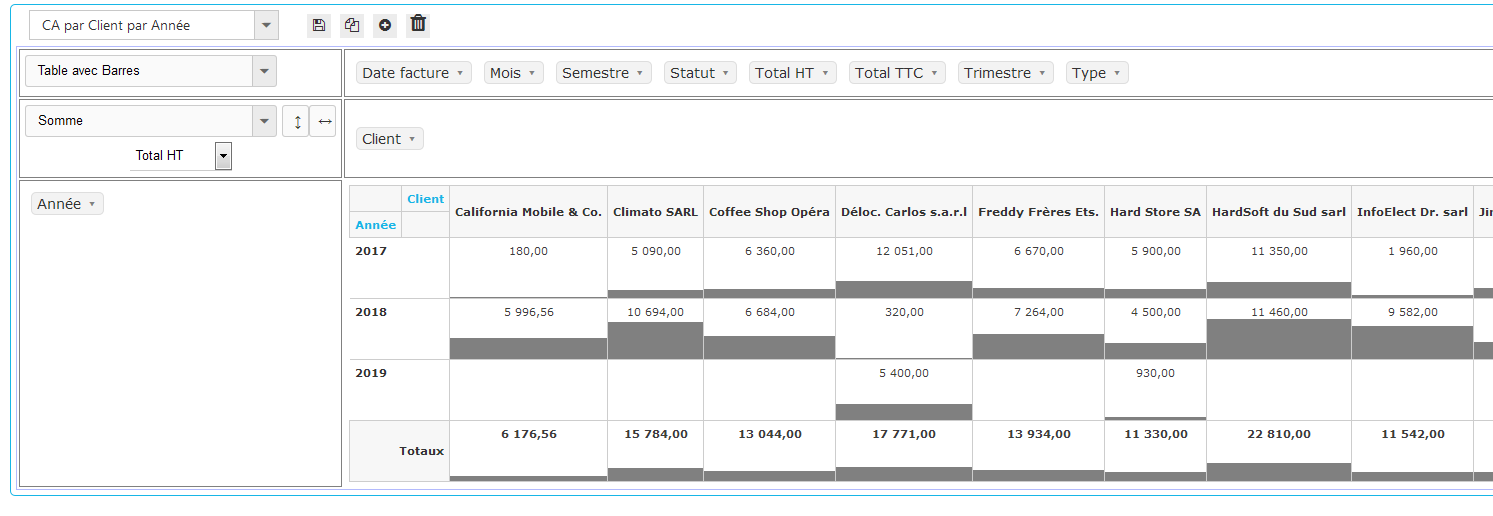
Table with heat map
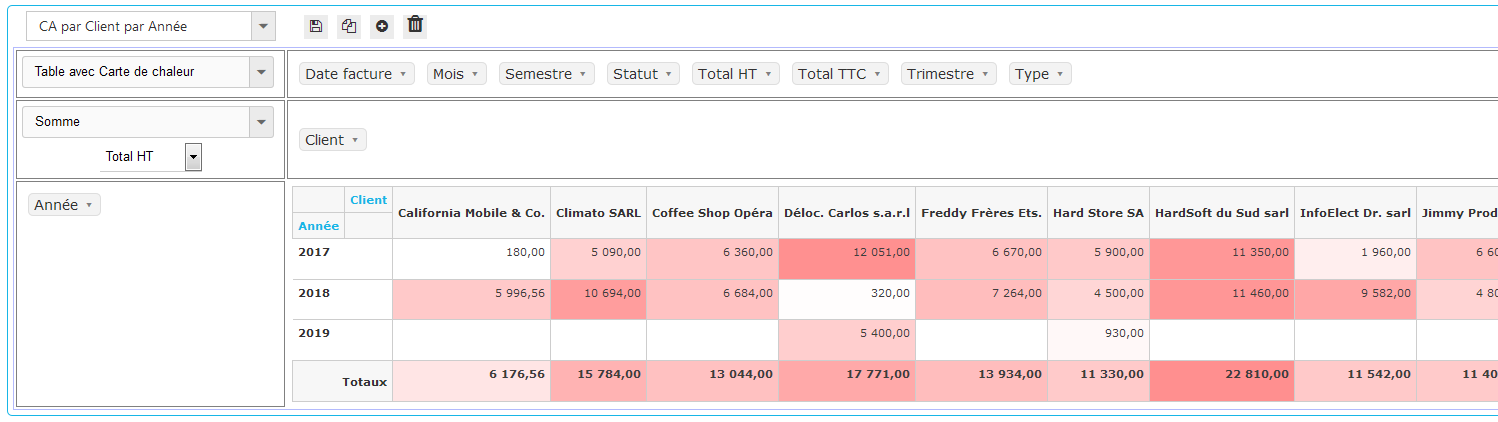
Table with subtotals
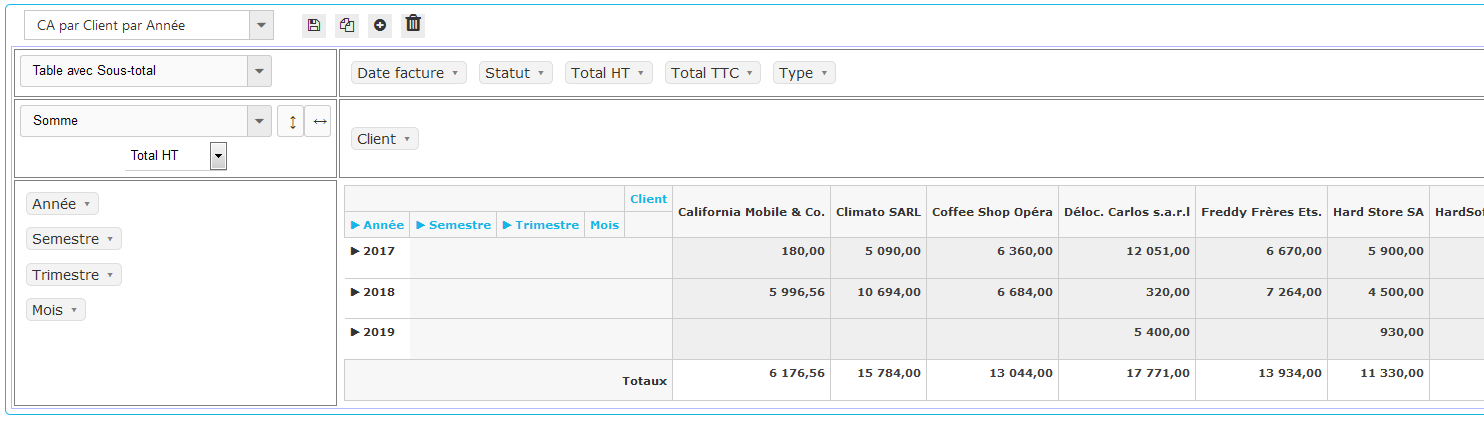
Zoom on data
Tables with subtotals provide the ability to “zoom” on the data and thus analyze it in depth.
To take advantage of this feature, several fields must be positioned in the rows and / or columns fields area.
These fields must also “nest” logically as, for example, “Year, Semester, Quarter, Month”.
The headers of the rows / columns can then be rolled up / expand to analyze the data in the desired depth.
The following animation shows how this works:
(Click on image to play animation)