
Complete examples
This section provides examples of Pivot report from the creation of the Data source (SQL Query) to the final report.
Sales by Representative
1- Data source
For the data source, we will be inspired by the query from the "Orders" data source.
We will just add what it takes to have the representative of each order.
The request is as follows:
SELECT t.date_commande AS date_commande, (CASE MONTH(t.date_commande) WHEN 1 THEN 'Jan' WHEN 2 THEN 'Fév' WHEN 3 THEN 'Mar' WHEN 4 THEN 'Avr' WHEN 5 THEN 'Mai' WHEN 6 THEN 'Jui' WHEN 7 THEN 'Juil' WHEN 8 THEN 'Aoû' WHEN 9 THEN 'Sep' WHEN 10 THEN 'Oct' WHEN 11 THEN 'Nov' WHEN 12 THEN 'Déc' ELSE '' END) AS Mois, (CASE QUARTER(t.date_commande) WHEN 1 THEN '1er Trim' WHEN 2 THEN '2e Trim' WHEN 3 THEN '3e Trim' WHEN 4 THEN '4e Trim' ELSE '' END) AS Trimestre, (CASE WHEN MONTH(t.date_commande) < 7 THEN '1er Sem' WHEN MONTH(t.date_commande) >= 7 THEN '2e Sem' ELSE '' END) AS Semestre, (CASE WHEN YEAR(t.date_commande) IS NOT NULL THEN YEAR(t.date_commande) ELSE '' END) AS Année, (CASE t.fk_statut WHEN -1 THEN 'Annulée' WHEN 0 THEN 'Brouillon' WHEN 1 THEN 'Validée' WHEN 2 THEN 'Livraison en cours' WHEN 3 THEN 'Livrée/Clôturée' ELSE '' END) AS Statut, t.total_ht AS total_ht, t.total_ttc AS total_ttc, llx_societe.nom AS client, u.login AS Commercial
FROM llx_commande AS t LEFT JOIN llx_societe ON t.fk_soc = llx_societe.rowid LEFT JOIN llx_element_contact ec ON t.rowid = ec.element_id LEFT JOIN llx_user u ON ec.fk_socpeople = u.rowid
WHERE ec.fk_c_type_contact = 91
To create this data source, go to the module's configuration page and then the "Data sources" tab.
Click on "News data source".
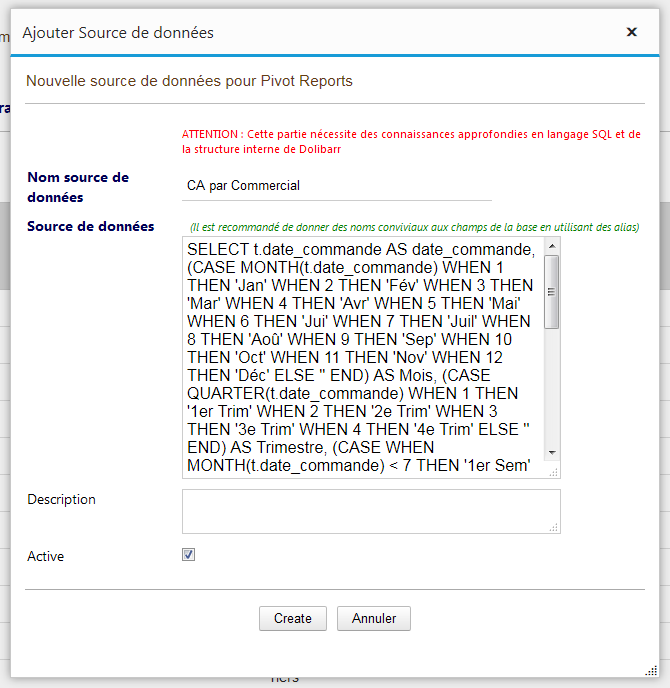
In the dialog that appears:
In the "Data Source Name" field, type "Sales by Representative"
Copy / Paste the above SQL query into the "Data Source" field
Click on "Create"
The new data source is then added to the list of Available Data Sources.
2- Report: Sales by Representative by Year Histogram
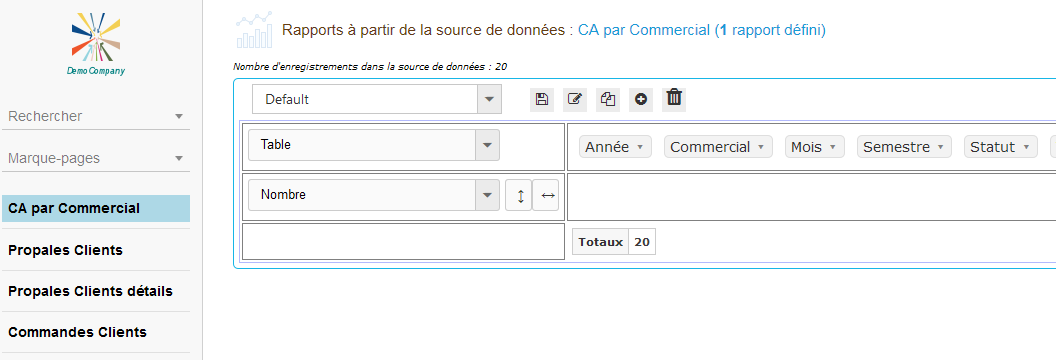
By opening the main screen of the module (click on the top menu "Pivot Reports"), we notice that:
- A new entry "Sales by Representative" has been added to the left menu
- By clicking on this entry in the left menu, a default empty report has been created and is called "Default".
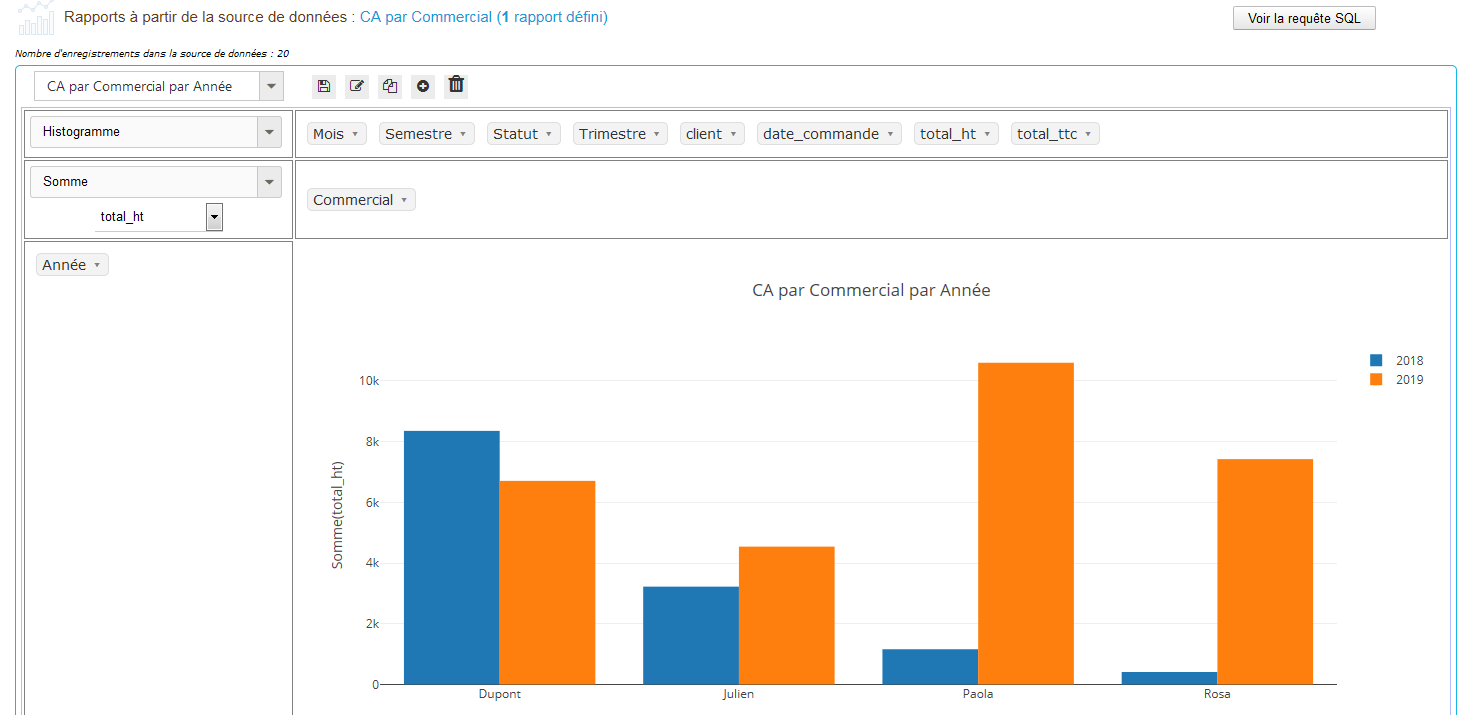
To create the report "Sales by Representative by Year" as a histogram, we will proceed as follows:
- Rename the Default report to "Sales by Representative by Year"
- Choose "Histogram" from the list of available views
- Choose "Sum" from the list of possible operations
- Choose "total_ht" from the list of available fields
- Drag&Drop the "Commercial" field into the X axis labels area
- Drag&Drop the "Année" field into the series area
- Save
N.B. This example assumes there is only one salesperson per order.
If you assign multiple sales representatives to a command, it is necessary to adapt the SQL query above accordingly.